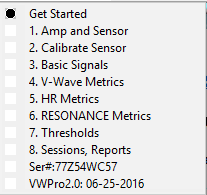
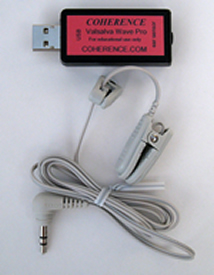
2. Amp & Sensor:
Regarding general use, Valsalva Wave Pro depends on the presence of the Amplifier and Sensor. If the Amplifier is unplugged from the PC when the application is running, the application will be interrupted. Also, if the Sensor is plugged into the Amplifier or unplugged from the Amplifier while the application is running, the application will be interrupted. It is best to plug the Sensor into the Amplifier, then plug the Amplifier into the USB port on the computer, then open the application. Follow this same process in reverse for unplugging the Amplifier and Sensor.
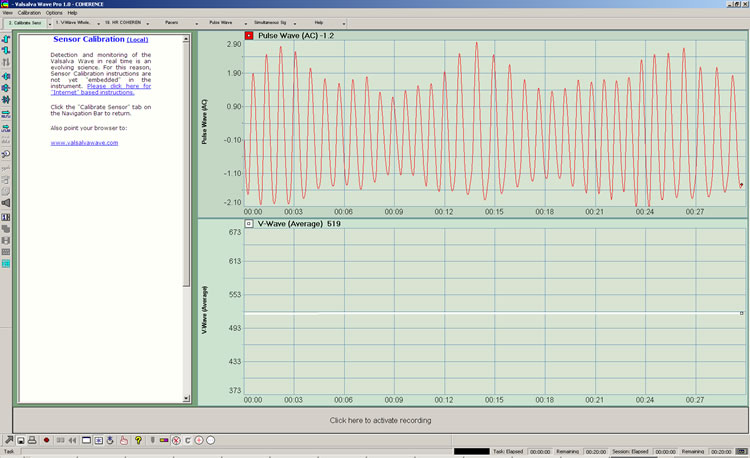
Sensor Calibration:
The Valsalva Wave Pro sensor must properly detect both changes in blood volume and the heart beat. If the sensor is too tight it inhibits changes in blood volume. It if is too loose it doesn't detect the heart beat. To insure proper operation, the pulse wave (top panel) should be consistent and the average Valsalva Wave should be "flat", and not drifting downward. It may take a few minutes for it to flatten as it is dependent on clip pressure, body position, and respiration.
Please note that the "drift kit" is required for proper detection and monitoring of simultaneous Valsalva Wave and Heart Rate. View the drift kit discussion below.
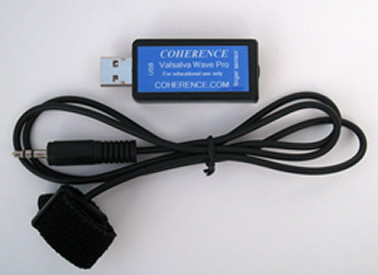
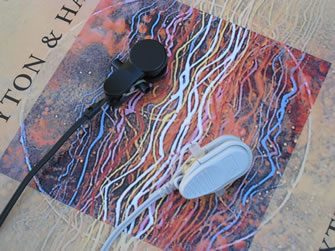
Drift Kit:
A "drift kit" (see photo) is normally installed when the ear sensor is shipped. It consists of a small plastic block and a rubber band that secures it to the ear sensor. The block prevents "biological" drift due to continuous squeezing of the ear by the ear clip spring. The block keeps the ear clip blocked open such that it does not squeeze past the point where the sides of the clip are parallel. This solves the drift problem but leads to a looser fit and therefore requires additonal care in attaching it to a part of the ear where it fits well. As long as the sensor picks up the AC Pulsewave signal (see Basic Signals), then it is secure enough.
3. Basic Signals: See description of each graph below.
It is recommended that each time that the sensor is fitted and a session started, that Basic Signals is verified. This insures that everything is plugged in correctly and that the sensor is properly fitted and operational. The graphic below is approximately what the Basic Signals screen should look like when one is breathing slowly, deeply, and rhythmically. The Basic Signal screen consists of 4 panels:
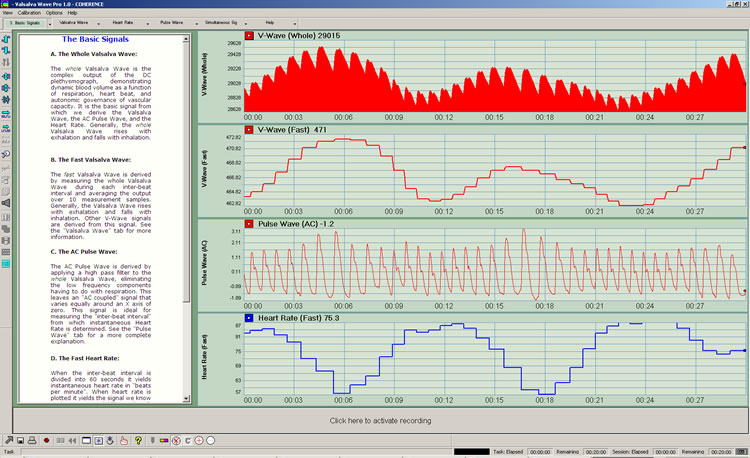
The Basic Signals
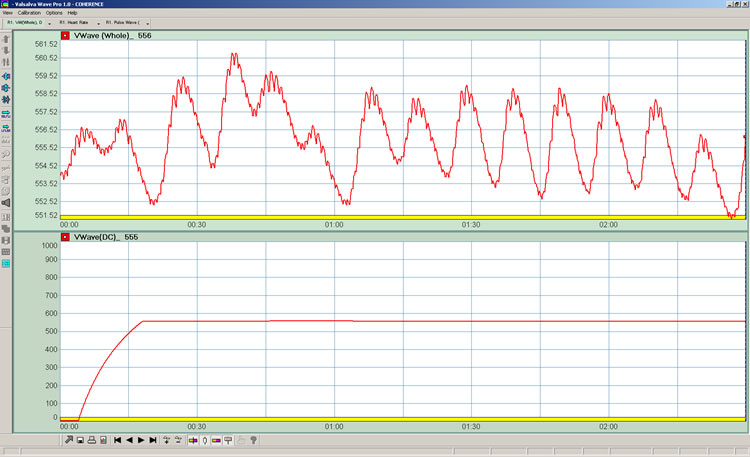
A. The Whole Valsalva Wave:
The whole Valsalva Wave is the complex output of the DC plethysmograph, demonstrating dynamic blood volume as a function of respiration, heart beat, and autonomic governance of vascular capacity. It is the basic signal from which we derive the Valsalva Wave, the AC Pulse Wave, and the Heart Rate. Generally, the whole Valsalva Wave rises with exhalation and falls with inhalation.
B. The Fast Valsalva Wave:
The fast Valsalva Wave is derived by measuring the whole Valsalva Wave during each inter-beat interval and averaging the output over 10 measurement samples. Generally, the Valsalva Wave rises with exhalation and falls with inhalation. Other V-Wave signals are derived from this signal. See the "Valsalva Wave" tab for more information.
C. The AC Pulse Wave:
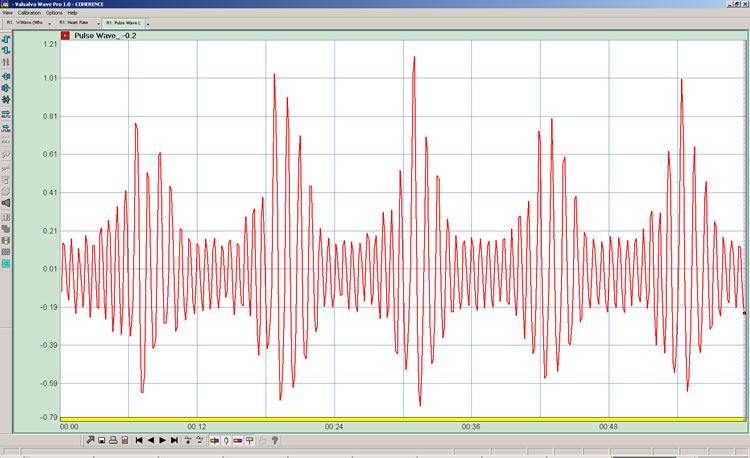
The AC Pulse Wave is derived by applying a high pass filter to the whole Valsalva Wave, eliminating the low frequency components having to do with respiration. This leaves an "AC coupled" signal that varies equally around an X axis of zero. This signal is ideal for measuring the "inter-beat interval" from which instantaneous Heart Rate is determined. See the "Pulse Wave" tab for a more complete explanation.
D. The Fast Heart Rate:
When the inter-beat interval is divided into 60 seconds it yields instantaneous heart rate in "beats per minute". When heart rate is plotted it yields the signal we know as heart rate variability or "HRV". HRV is a measure of the extent to which the heart beat rate varies. Generally, Heart Rate rises with inhalation and falls with exhalation. Other Heart Rate signals are derived from this signal. See the "Heart Rate" tab for a more complete explanation.
4. Valsalva Wave Metrics:
See description of each graph below. Valsalva Wave signals are "Red".
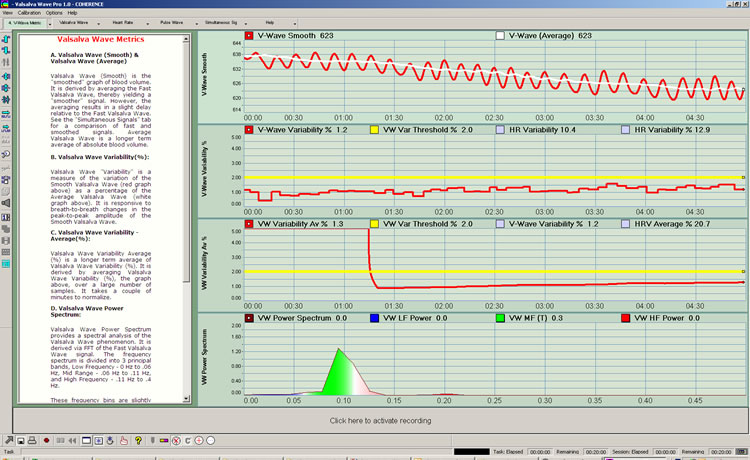
Valsalva Wave Metrics
A. Valsalva Wave (Smooth) & Valsalva Wave (Average):
Valsalva Wave (Smooth) is the "smoothed" graph of blood volume. It is derived by averaging the Fast Valsalva Wave, thereby yielding a "smoother" signal. However, the averaging results in a slight delay relative to the Fast Valsalva Wave. See the "Simultaneous Signals" tab for a comparison of fast and smoothed signals. Average Valsalva Wave is a longer term average of the smooth Valsalva Wave.
B. Valsalva Wave Magnitude:
Valsalva Wave "magnitude" is a measurement of the peak-to-peak amplitude of the Fast Valsalva Wave averaged over a relatively short period. It is responsive to breath-to-breath changes in the peak-to-peak amplitude of the Valsalva Wave.
C. Valsalva Wave Magnitude - Average:
Valsalva Wave Magnitude "Average" is a longer term average of the peak-peak amplitude of the Valsalva Wave. It is derived by averaging Valsalva Wave Magnitude over a large number of samples.
D. Valsalva Wave Power Spectrum:
Valsalva Wave Power Spectrum provides a spectral analysis of the Valsalva Wave phenomenon. It is derived via FFT of the Fast Valsalva Wave signal. The frequency spectrum is divided into 3 principal bands, Low Frequency - 0 Hz to .06 Hz, Mid Range - .06 Hz to .11 Hz, and High Frequency - .11 Hz to .4 Hz.
5. Heart Rate Metrics:
See description of each graph below. Heart rate signals are "Blue".
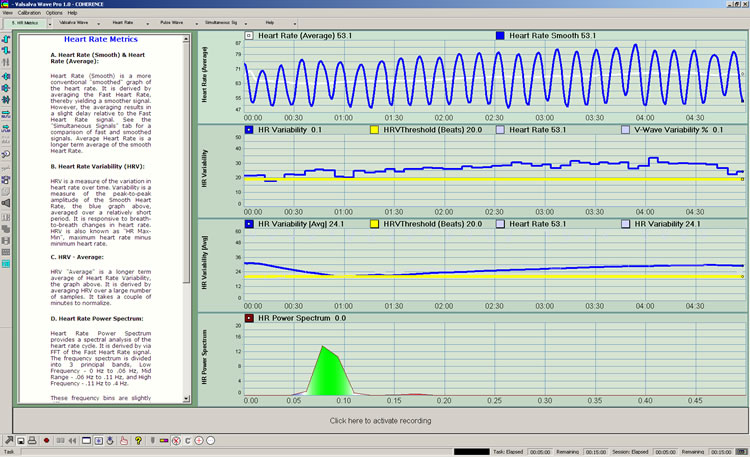
Heart Rate Metrics
A. Heart Rate (Smooth) & Heart Rate (Average):
Heart Rate (Smooth) is a more conventional "smoothed" graph of the heart rate. It is derived by averaging the Fast Heart Rate, thereby yielding a smoother signal. However, the averaging results in a slight delay relative to the Fast Heart Rate signal. See the "Simultaneous Signals" tab for a comparison of fast and smoothed signals. Average Heart Rate is a longer term average of the smooth Heart Rate.
B. Heart Rate Variability (HRV) Amplitude:
HRV Amplitude is a measurement of the peak- to-peak amplitude of the Fast Heart Rate averaged over a relatively short period. It is responsive to breath-to-breath changes in the peak-to-peak amplitude of the HRV cycle. HRV Amplitude is also known as "maximum heart rate minus minimum heart rate".
C. HRV Amplitude - Average:
HRV Amplitude "Average" is a longer term average of the peak-peak amplitude of the HRV cycle. It is derived by averaging HRV Amplitude over a large number of samples.
D. Heart Rate Power Spectrum:
HR Power Spectrum provides a spectral analysis of the heart beat rate. It is derived by via FFT of the Fast Heart Rate signal.The frequency spectrum is divided into 3 principal bands, Low Frequency - 0 Hz to .06 Hz, Mid Range - .06 Hz to .11 Hz, and High Frequency - .11 Hz to .4 Hz.
6. Resonance Metrics:
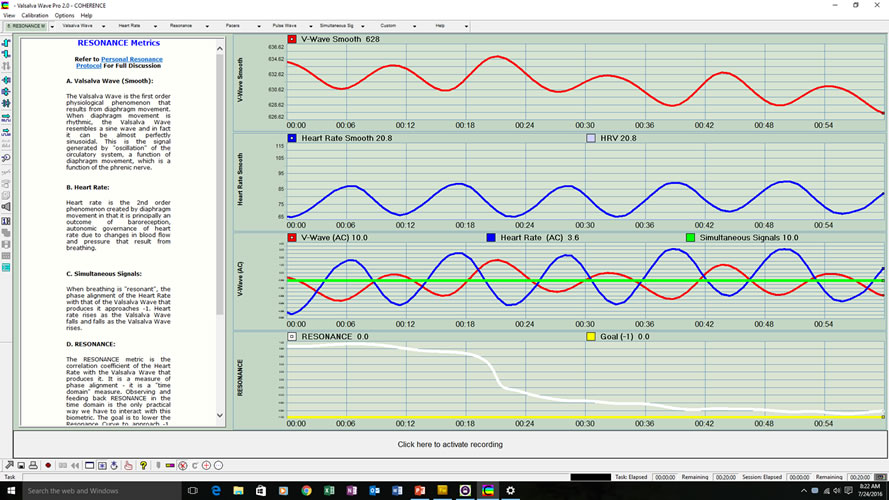
A. Valsalva Wave (Smooth):
The Valsalva Wave is the first order physiological phenomenon that results from diaphragm movement. When diaphragm movement is rhythmic, the Valsalva Wave resembles a sine wave and in fact it can be almost perfectly sinusoidal. This is the signal generated by "oscillation" of the circulatory system, a function of diaphragm movement, which is a function of the phrenic nerve. |
B. Heart Rate:
Heart rate is the 2nd order phenomenon created by diaphragm movement in that it is principally an outcome of baroreception, autonomic governance of heart rate due to changes in blood flow and pressure that result from breathing. |
C. Simultaneous Signals:
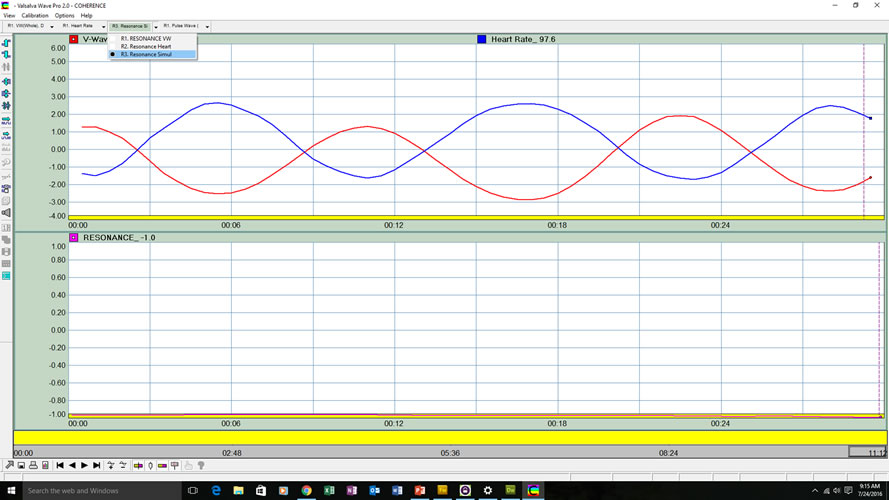
When breathing is "resonant", the phase alignment of the Heart Rate with that of the Valsalva Wave that produces it approaches -1. Heart rate rises as the Valsalva Wave falls and falls as the Valsalva Wave rises. |
D. RESONANCE:
The RESONANCE metric is the correlation coefficient of the Heart Rate with the Valsalva Wave that produces it. It is a measure of phase alignment - it is a "time domain" measure. Observing and feeding back RESONANCE in the time domain is the only practical way we have to interact with this biometric. The goal is to lower the Resonance Curve to approach -1. Once we know how to do this, we record the session and post process it to determine the precise frequency that produced the alignment. Fourier Analysis allows us to see the signal in the "frequency domain". |
7. Thresholds:
With Release 1.1, Valsalva Wave Pro provides visual thresholding for Valsalva Wave and Heart Rate functions.
This includes Valsalva Wave (AC), Valsalva Wave Variability, and Valsalva Wave Variability Average screens. Equivalent thresholding is provided for Heart Rate, Heart Rate Variability, and Heart Rate Variability Average screens. Thresholds are indicated by an adjustable horizontal yellow line that can be moved up or down to indicate the training goal.
A yellow "Threshold" legend is presented at the top of those screens that support thresholding. Also, the "Threshold" button is available on the toolbar. When the threshold button is clicked, the Threshold Settings dialog box appears, allowing the threshold of interest to be selected, and its value established.
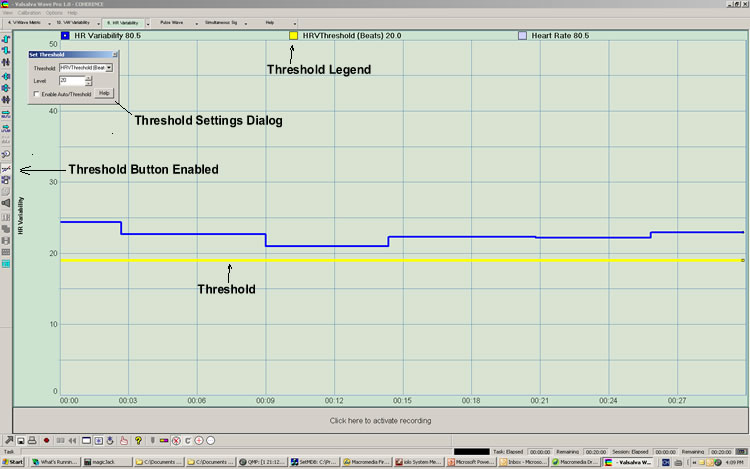
Heart Rate Variability screen depicting a threshold set at 20 beats
Please note that on variability measurement screens (with a fixed Y-axis) threshold values correlate with the Y axis. On screens where gain is automatically adjusted (and values on the Y-axis vary with gain), threshold values are simply numerical. Also, thresholds are presently not printed on reports.
It is recommended that threshold values are recorded using the Event Marker function which is available on recorded reports. Below is an example of a single event marker that captures the threshold for the Heart Rate Variability measurement. Where there is an upper and lower threshold, 2 event markers are presently required.
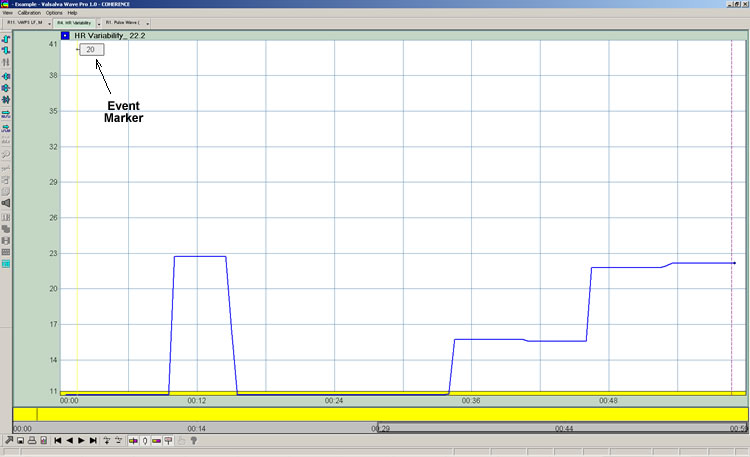
Recorded "report" depicting Event Marker with threshold value
To create an event marker, when in record mode, click the green "marker" on the Control Bar along the bottom of the screen. A small input window will open briefly. Input the threshold value and hit "return". It then appears on reports as depicted above and with exported data.
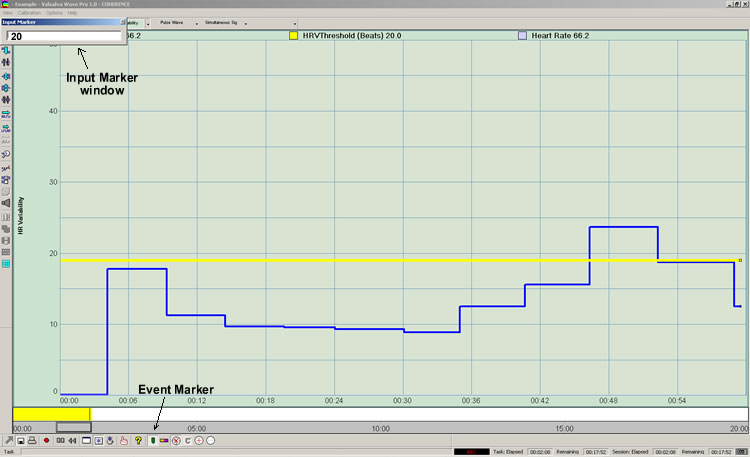
Using Event Marking to record threshold values
8. Sessions & Reports:
Valsalva Wave Pro allows the user to run sessions, record session data, and generate reports. Users can access any one of the pre-defined "report screens" or export the data to generate reports externally.

The most basic entry and exit screen
To run a session, click on the run session button. Using the primary Navigation Bar at the top of the screen choose the screen you wish to view. To record a session, click on the "record button" depicted in the bottom control bar below. (Valsalva Wave Pro records all of the signals that are being generated by the instrument, not just the one that is presented at any given moment. This allows the user, for example, to record the Valsalva Wave and once the session ends, examine other metrics as they occurred in time, for example Heart Rate.) The yellow bar will begin advancing to the right, indicating that the session is being recorded.
To end recording, the record button must be pushed again. Recording stops and the yellow bar disappears. To save the session, click on the "stop" arrow in the lower left corner. (The stop arrow must be pressed to exit any active screen.)
Note that recorded sessions are limited to 20 minutes each. A biofeedback session can continue without time limit, but a given record is limited to 20 minutes and begins when the "record" button is pressed.
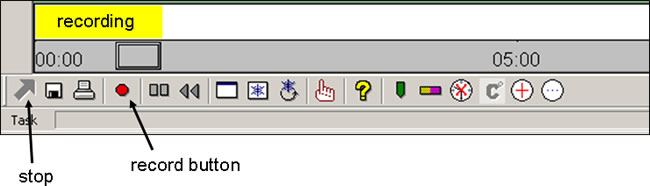
The bottom control bar
When the stop arrow is pressed, the "Save Session Data" dialog box is presented. If it is a new client, click the "New Client" button and complete the form. If it is an existing client, click the drop down arrow to select the client name. Once the name has been selected click "Save To Database". Once saving is complete. click on the "X" in the upper right hand corner of this dialog box to close. This will return the user to the entry screen from which you can run another session, access client data, etc.
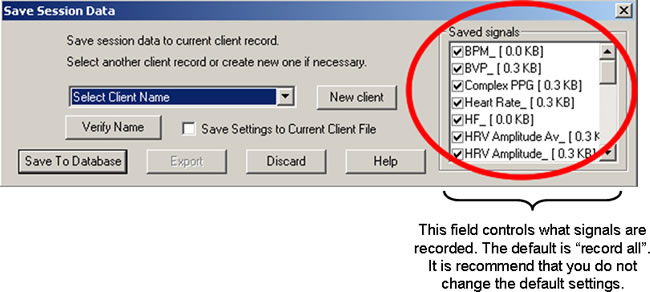
The "Saved Signals" field highlighted by the red circle determines what signals the instrument saves during each session. The default setting is "all signals", i.e, all of the check boxes are checked. It is recommended that you do not change the default settings.
Note: All screens can be paused and "screen printed" at any time by clicking the "Freeze Screen" icon  on the bottom "Control Bar". It is recommended that you print the screen by freezing the screen, copying the screen by using the "print screen" command on your PC, and pasting the screen into PowerPoint or another application, then printing. Please avoid using the print screen on the bottom "Control Bar". It is recommended that you print the screen by freezing the screen, copying the screen by using the "print screen" command on your PC, and pasting the screen into PowerPoint or another application, then printing. Please avoid using the print screen  button on the Control Bar because it produces a very large bitmap file and can result in printing problems. button on the Control Bar because it produces a very large bitmap file and can result in printing problems.
Valsalva Wave Reports:
This selection explains the standard reports provided. When a session is recorded, Valsalva Wave Pro records the data associated with any or all signals. Afterwards, the session can be selected and the data can be viewed or exported. The following reports are those automatically generated in Version 1.0. Data is available for all signals for purposes of exporting. Instructions for viewing and generating reports can be found under the Help menu.
Valsalva Wave signals are "Red". Heart Rate signals are "blue".
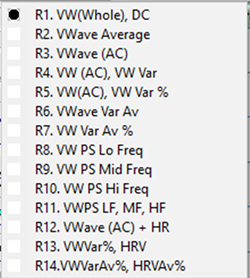
R1. Valsalva Wave (Whole):
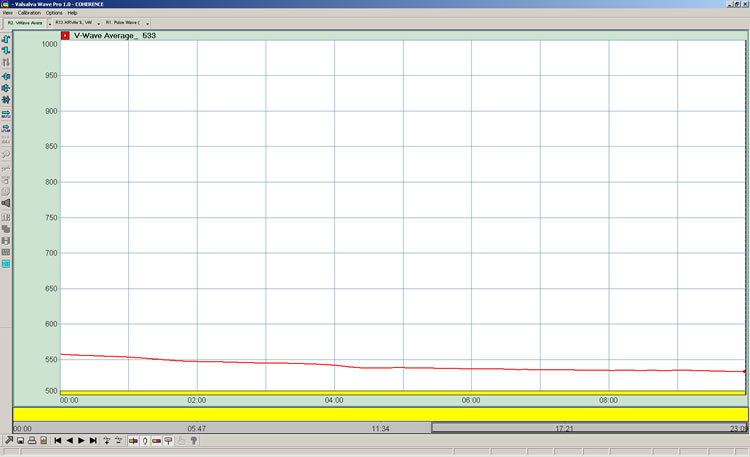
R2. Valsalva Wave (Average):
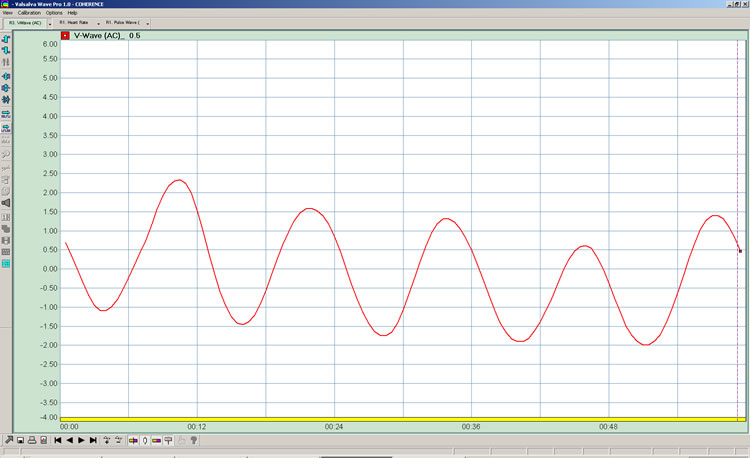
R3. Valsalva Wave (AC): The Valsalva Wave varying around an X-axis of zero.
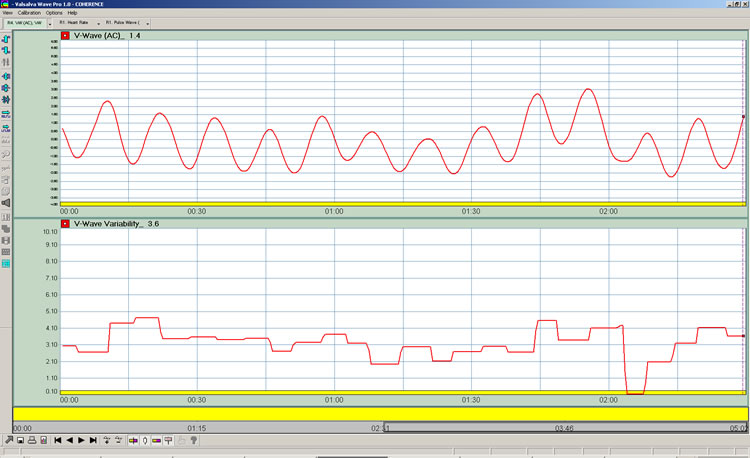
R4. Valsalva Wave AC and Valsalva Wave Variability: The top panel is Valsalva Wave AC and the bottom panel is Valsalva Wave Variability. The variability graph is a measure of the peak-peak amplitude of Valsalva Wave AC.
R5. Valsalva Wave AC is the top panel and Valsalva Wave Variability as a percentage of blood volume is the bottom panel:

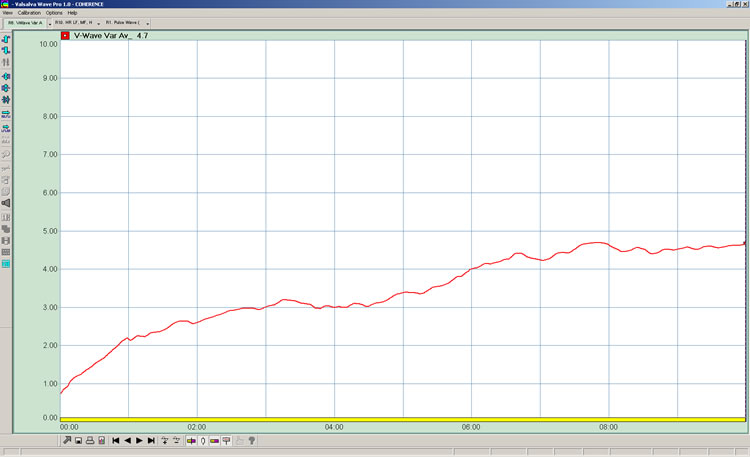
R6. Valsalva Wave Variability (Average):
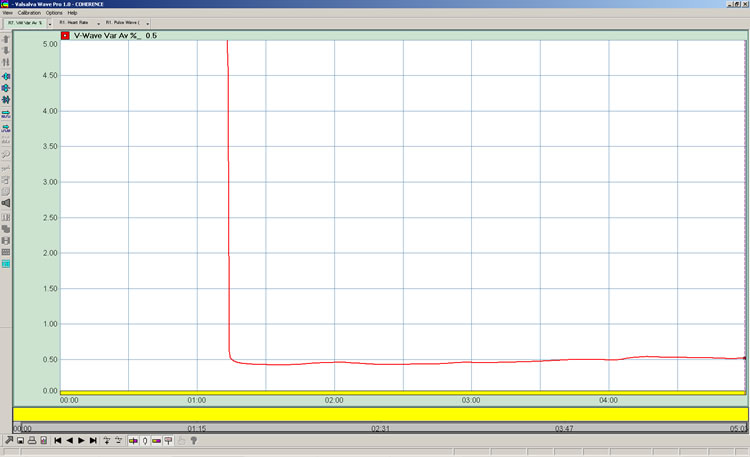
R7. Valsalva Wave Variability (Average)%:
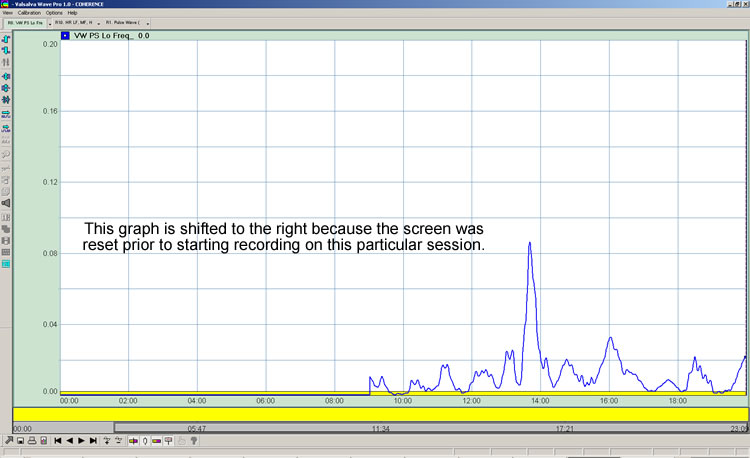
R8. Valsalva Wave Power Spectrum - Low Frequency:
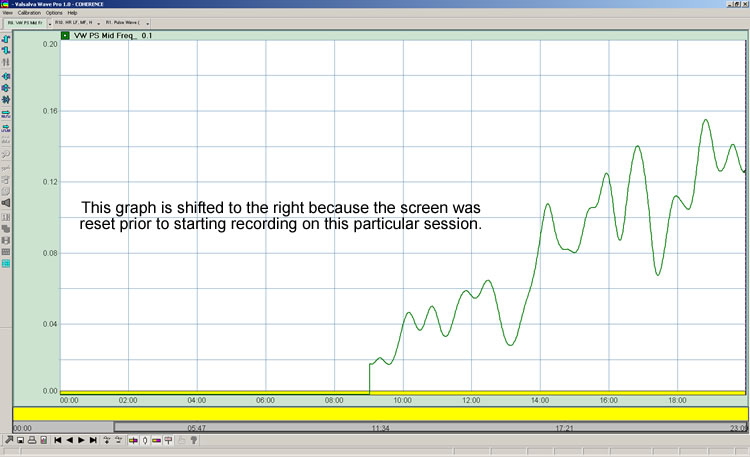
R9. Valsalva Wave Power Spectrum - Mid Frequency:
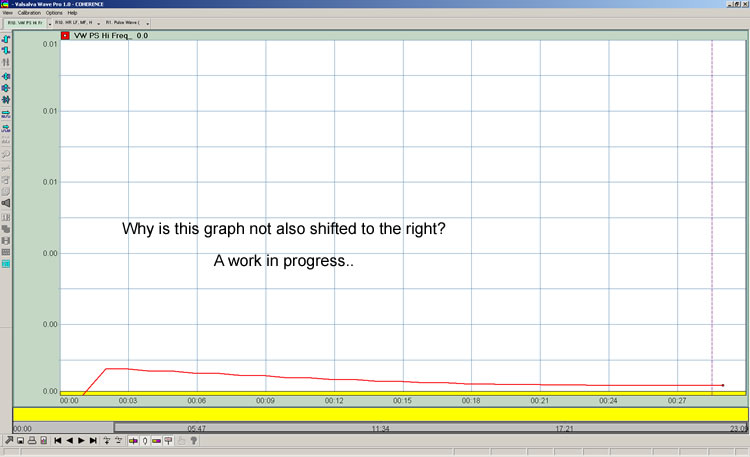
R10. Valsalva Wave Power Spectrum - High Frequency:
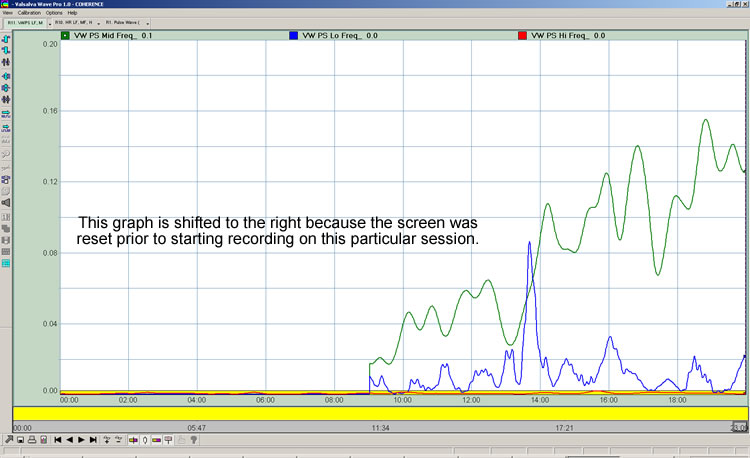
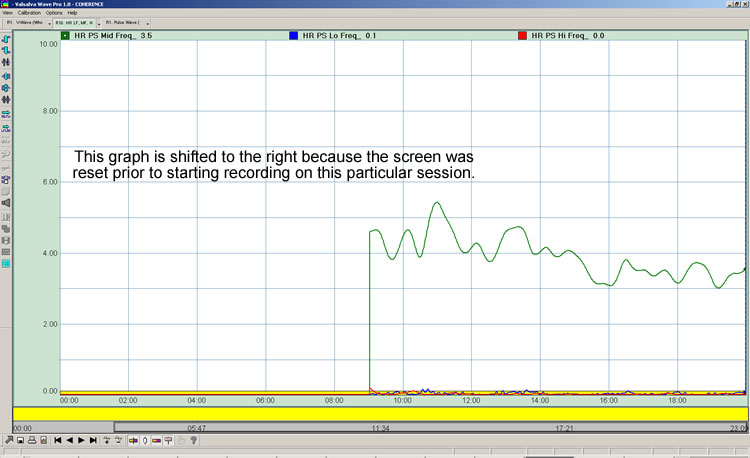
R11. Valsalva Wave Power Spectrum - LF, MF, HF:
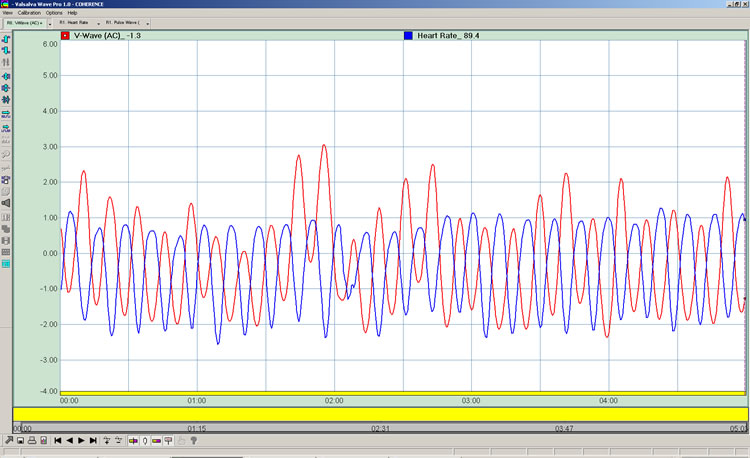
R12. Valsalva Wave (AC) AND Heart Rate:
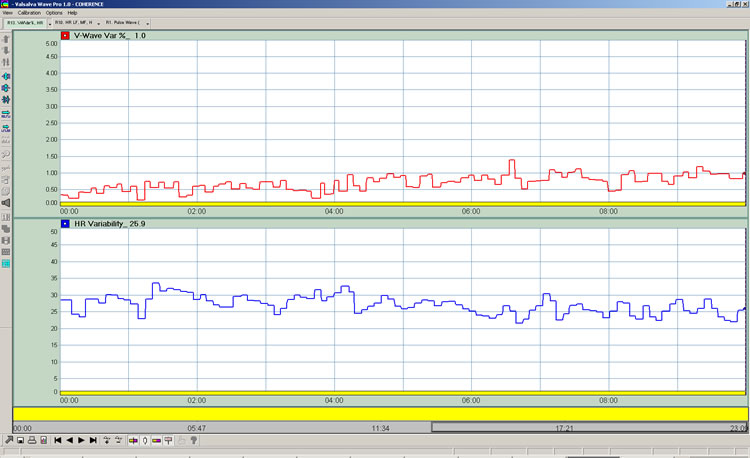
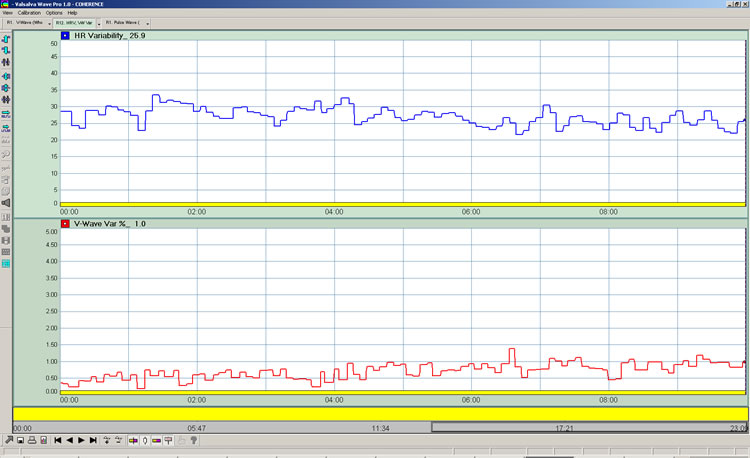
R13. Valslava Wave Variability (%), Heart Rate Variability:
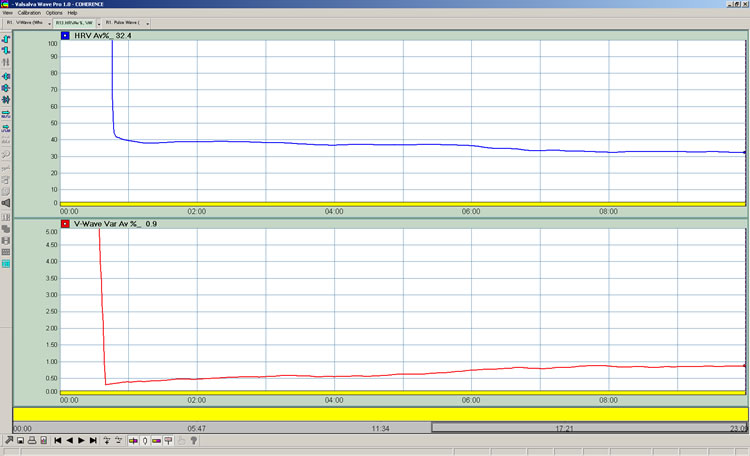
R14. Valsalva Wave Variability (Average) %, Heart Rate Variability (Average) %:

Heart Rate Reports:
Heart Rate signals are "Blue". Valsalva Wave signals are "red".
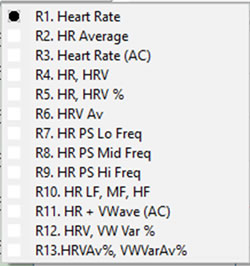
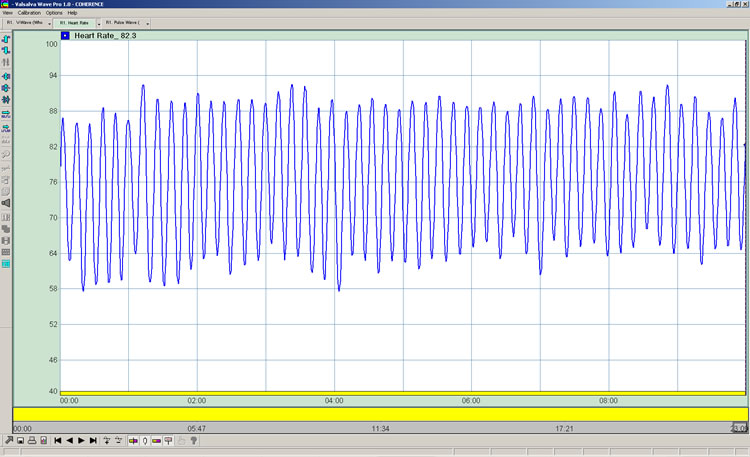
R1. Heart Rate:
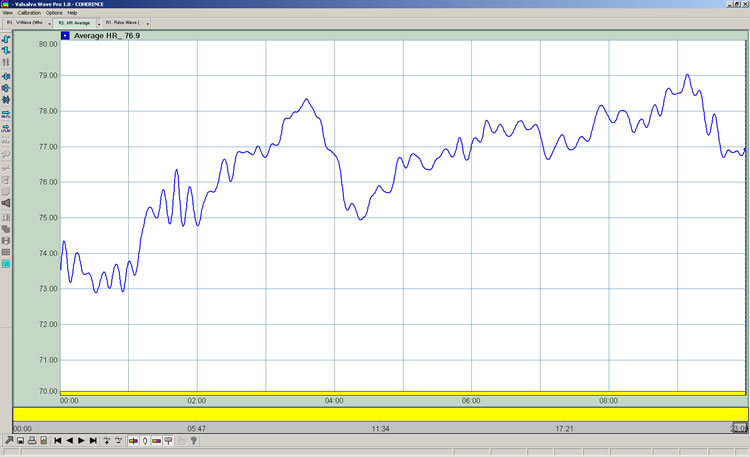
R2. Heart Rate Average:
R3. Heart Rate (AC):
.jpg)
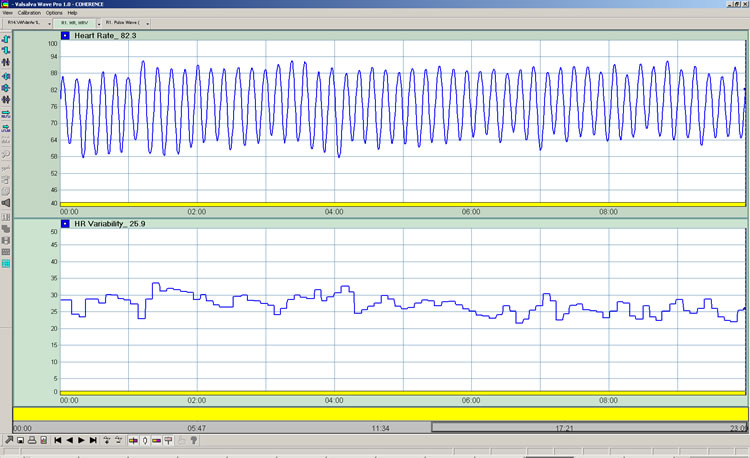
R4. Heart Rate, Heart Rate Variability:
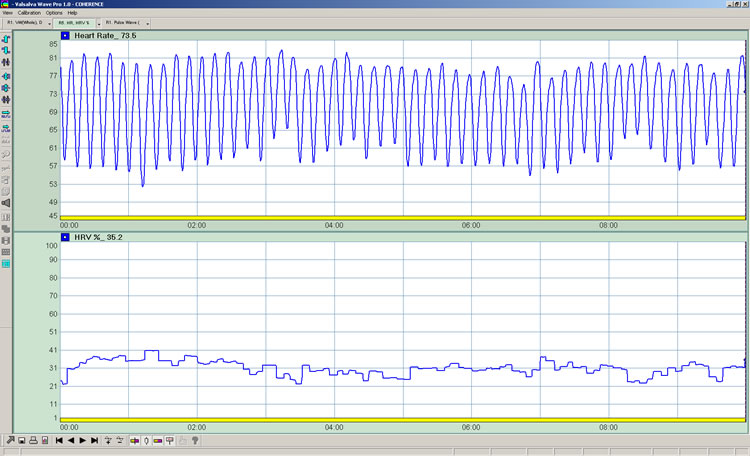
R5. Heart Rate, Heart Rate Variability %:
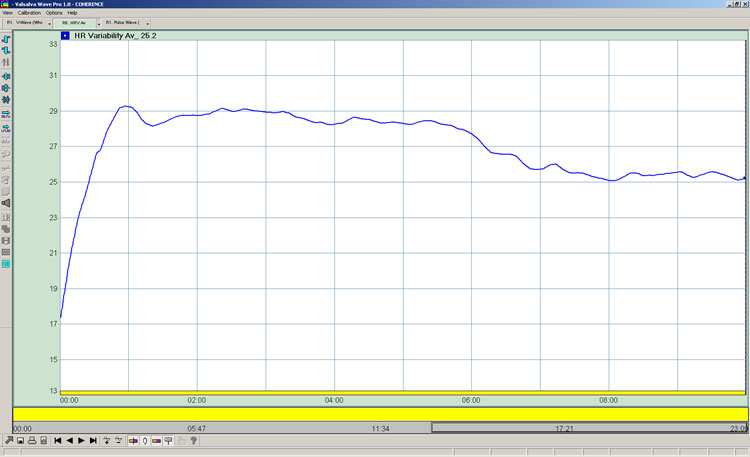
R6. Heart Rate Variability (Average):
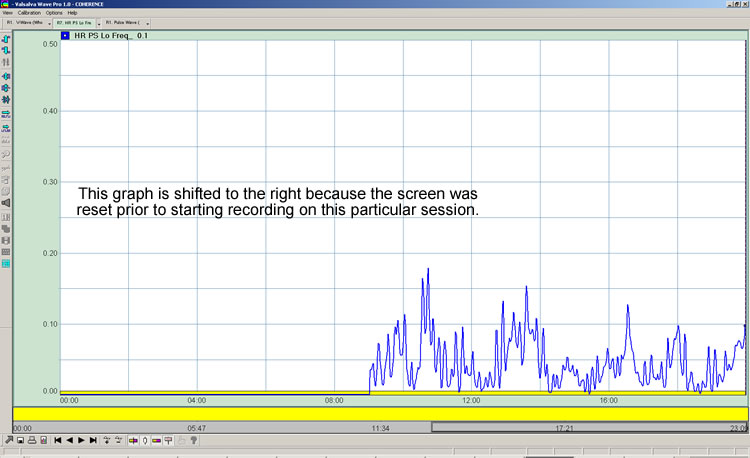
R7. Heart Rate Power Spectrum - LF:
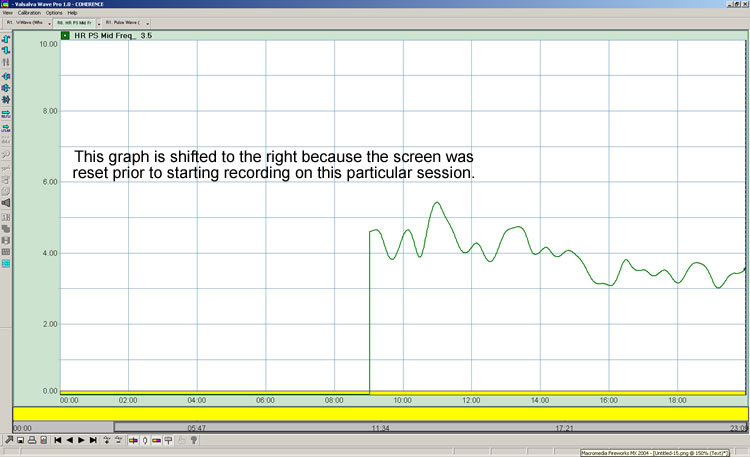
R8. Heart Rate Power Spectrum - MF:
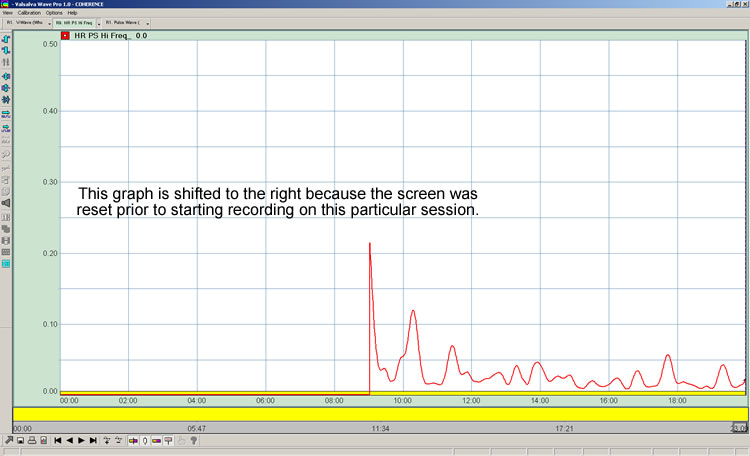
R9. Heart Rate Power Spectrum - HF:
R10. Heart Rate Power Spectrum - LF, MF, HF:
R11. Heart Rate AND Valsalva Wave (AC):
.jpg)
R12. Heart Rate Variability, Valsalva Wave Variability%:
R13. Heart Rate Variability (Average) %, Valsalva Wave Variability (Average) %:
Resonance Reports
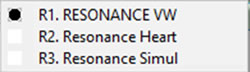
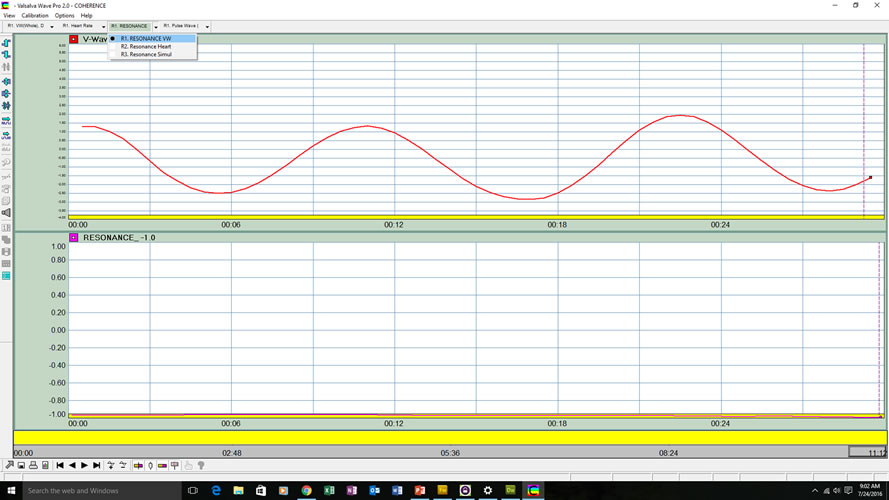
R1. RESONANCE Valsalva Wave: The upper panel is Valsalva Wave Smooth and the lower panel is RESONANCE.
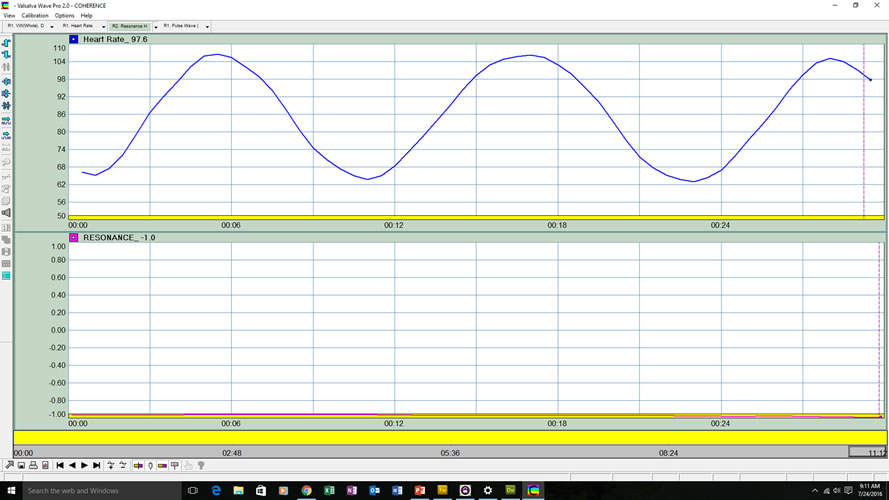
R2. RESONANCE Heart (Heart Rate Variability Cycle): The upper panel is Heart Rate Smooth and the lower panel is RESONANCE.
R3. RESONANCE Simultaneous: The upper panel is Valsalva Wave Smooth (red) AND Heart Rate Smooth (blue). The lower panel is RESONANCE.
Pulse Wave Reports:

R1. Pulse Wave (AC):
Copyright 2016 COHERENCE LLC
(V2.0 July 2016) |

