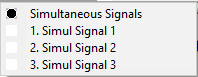
Simultaneous Signals
The Menu
This group of screens is provided primarily for purposes of understanding nuances of the Valsalva Wave instrument including signal relationships.
1. Simul Signal 1 (Simultaneous Signals 1): allows comparison of "Valsalva Wave Fast" and "Valsalva Wave Smooth" signals on the left and "Heart Rate Fast " and "Heart Rate Smooth" signals on the right.
2. Simul Signal 2 (Simultaneous Signals 2): allows comparison of "Valsalva Wave Fast" and "Heart Rate Fast " signals on the left and "Valsalva Wave Smooth" and "Heart Rate Smooth" signals on the right.
3. Simul Signal 3 (Simultaneous Signals 3): allows comparison of "Valsalva Wave Fast" and "Heart Rate Fast " signals on the left and "Valsalva Wave Magnitude" and "Heart Rate Variability Amplitude " signals on the right.
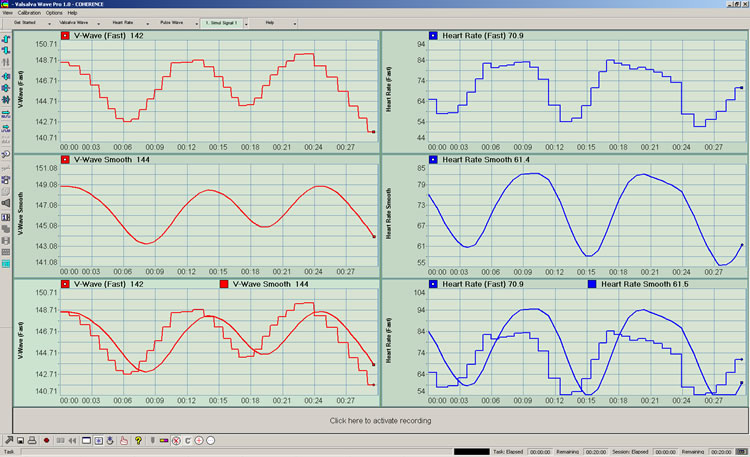
1. Simultaneous Signals 1: This screen presents simultaneous views of Valsalva Wave and Heart Rate. It is for purposes of understanding the time differences between Fast Valsalva Wave and Smooth Valsalva Wave (on the left) and Fast Heart Rate and Smooth Heart Rate (on the right). Timing differences between fast and smooth waves exist due to the averaging applied to produce the smooth wave.
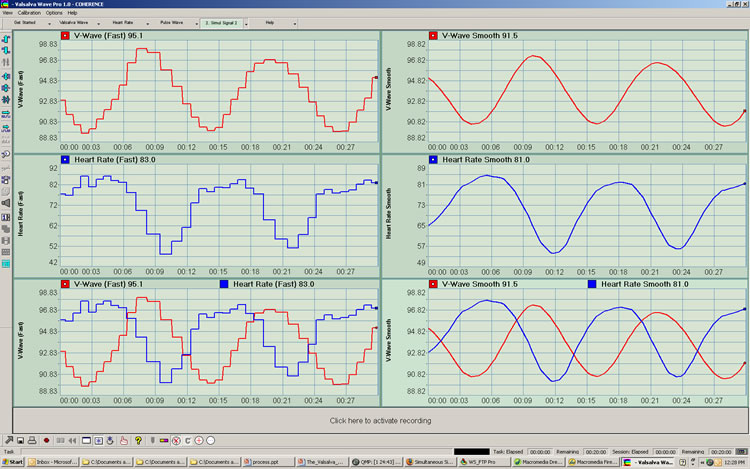
2. Simultaneous Signals 2: This screen presents simultaneous views of Fast Valsalva Wave and Fast Heart Rate on the left and Smooth Valsalva Wave and Smooth Heart Rate on the right. It is for purposes of understanding timing differences between Fast signals and between Smooth signals.
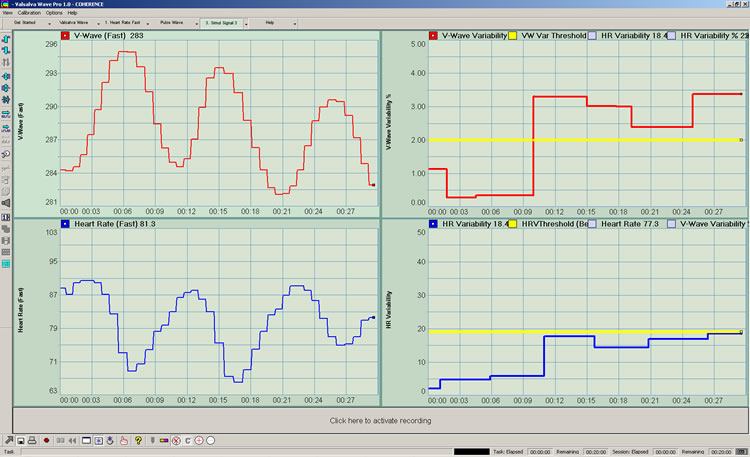
3. Simultaneous Signals 3: This screen depicts Fast Valsalva Wave and Fast Heart Rate on the left and Valsalva Wave Variability and Heart Rate Variability on the right. The fast waves are the basis of both Valslava Wave and Heart Rate variability measurements (throughout the instrument).
Copyright 2016 COHERENCE LLC
(V2.0 July 2016) |

